Jun 23, 2026
World Cup bets today: Five group stage picks for Tuesday ft. Uzbekistan vs. Portugal [6/23/2026]
Read Article See how Dimers' player projections model underlined Messi, Mbappe, and Haaland as the top goalscorer plays before they made World Cup history - again.
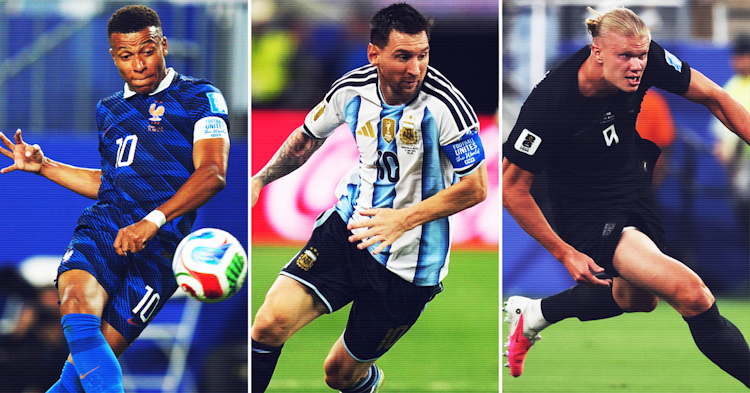
Before World Cup 2026 kicked off, there were three names that dominated the Golden Boot conversation: Messi, Mbappé, and Haaland.
It’s one thing for all three to find the back of the net on the same day. It’s another for all three to bag a brace. But for them to accomplish that collective multi-goal feat twice in a single tournament? That is pure history.
But, surprisingly, you wouldn’t have been surprised if you looked at the data before kickoff.
Our World Cup Player Projections identified the trio as the day's three most likely anytime goalscorers. Those same projections power our World Cup Best Player Props, helping Dimers Pro members spot value, shop for the best prices, and build smarter props and parlays based on probability—not hype.
The narrative was all over these three from the moment the tournament began. But their Matchday 1 and Matchday 2 performances weren't written in the stars—they were written in the numbers.
Before backing the next goalscorer prop or building your next World Cup parlay, here's a look at what our model saw before kickoff and the lessons they offer for spotting value in the matches ahead.
The elite trio reached the same destination—two goals each—but they didn't get there in the same way.
Each player entered their Matchday 2 fixture with a different statistical range, from Messi’s controlled efficiency to Mbappé’s elite volume to Haaland’s ruthless conversion rate. What united them wasn't identical projections but a shared signal: each ranked among the strongest goal-scoring opportunities on the schedule, with meaningful upside beyond simply scoring once.
Here's how those pre-match projections compared with what ultimately unfolded on the pitch.
The data point here wasn't raw volume dominance—it was efficiency within a controlled shot environment.
In Argentina vs. Austria, that productivity-driven output showed up in how Messi’s involvement consistently came from high-value zones rather than sustained pressure.
Metric | Dimers Pro Projection | Result |
Shots | 3.0 | 6 |
Shots on target | 1.3 | 2 |
Anytime goal probability | 39.6% | ✅ Scored |
2+ goal probability | 8.8% | ✅ 2 goals |
Messi ultimately generated twice as many shots as projected and 54% more shots on target, scoring twice despite missing a penalty. Following a hat-trick against Algeria on MD1, Monday's brace also saw him become the highest goalscorer in World Cup history, getting a head start on the headlines before Mbappé and Haaland followed suit.
That missed spot kick is a reminder that variance is always part of football, but it also reinforces the model's underlying benchmark: an elite attacker repeatedly finding himself in dangerous scoring positions. The projection wasn't trying to predict an exact stat line—it was identifying baseline outcomes before kickoff.
This was the clearest ceiling of the three.
High shot volume, high involvement, and multiple attacking pathways placed Mbappé in a fundamentally different category: not just a likely scorer, but a player structurally positioned for repeat scoring events if the game state opened early.
The France vs. Iraq fixture played out in a way that naturally aligned with that assessment, with space and transition moments reflecting the model’s pre-match expectation.
Metric | Dimers Pro Projection | Result |
Shots | 4.8 | 8 |
Shots on target | 2.0 | 3 |
Anytime goal probability | 57.4% | ✅ Scored |
2+ goal probability | 20.6% | ✅ 2 goals |
Mbappé generated 67% more shots and 50% more shots on target than projected. While a mid-match weather delay briefly disrupted rhythm, the underlying attacking style remained intact: volume, elite finishing, and repeated counterattacks.
Haaland's forecast was structurally different: fewer touches, extreme conversion efficiency, and a strong reliance on high-quality central chances.
The Norway vs. Senegal matchup became a clear example of burst scoring in action and high-impact scoring moments.
Metric | Dimers Pro Projection | Result |
Shots | 2.7 | 5 |
Shots on target | 1.2 | 3 |
Anytime goal probability | 37.8% | ✅ Scored |
2+ goal probability | 8.3% | ✅ 2 goals |
Haaland exceeded his projected shot volume by 85% and produced 2.5x his projected shots on target. While he comfortably outperformed expectations on volume, the underlying pattern matched the model’s read: repeated high-quality chances for one of the world’s most efficient finishers.
The value of this Matchday wasn’t that three elite players scored twice.
It’s that the data once again pointed to these outcomes before kickoff—across three different attacking styles, three different match environments, and three different ways of reaching the same result.
The lesson isn’t hindsight analysis. It’s learning to recognize those signals before the match starts.
That’s where edges are actually found. Not in the final score, but in the structure that leads to it.
Popular consensus got the players right. The data got the magnitude right.
And magnitude matters: a 40% anytime goal probability is not a guarantee—it’s a strong attacking position over repeated simulations. An 8–20% 2+ goal range is not “unlikely” in isolation; it’s a low-frequency but highly meaningful tail that becomes powerful when elite profiles align on the same slate.
The projection came first; the match unfolded later.
Dimers Pro’s World Cup Player Projections and Best Props are built around that process: identifying those indicators before kickoff across every World Cup matchup.
Start your 3-day free trial of Dimers Pro today and see every World Cup edge we’re tracking before the market catches up.

Kieron Byatt brings 18 years of experience in media and digital content to his role as Senior Writer at Cipher Sports Technology Group. A passionate sports bettor and fantasy manager, Kieron closely follows NFL, NBA, and EPL, with strong interest in MLB and NHL.